Rust observability matters most when the system is already under pressure
Why observability in Rust-based financial and trading infrastructure should be designed for latency-sensitive production systems, not added later as a debugging convenience.
Most teams say observability matters, but many still treat it like something that can be layered on after the critical system is already built. That approach is especially dangerous in financial and trading infrastructure. By the time a low-latency engine, market data pipeline, or risk path is under real production pressure, the absence of disciplined observability is no longer an inconvenience. It becomes an operational liability.
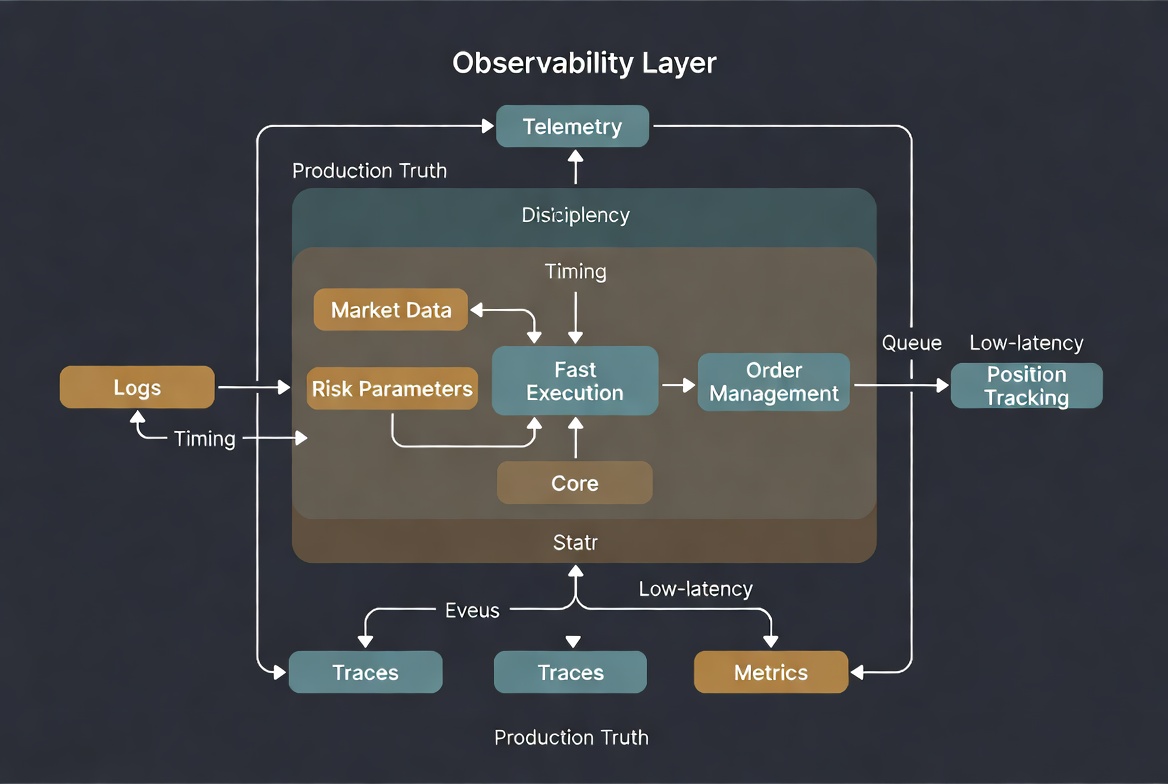
This is why observability in Rust systems deserves more respect than the usual logs-and-dashboards conversation. In serious infrastructure, observability is not just about seeing errors after the fact. It is about understanding queue pressure, event flow, scheduling delays, tail latency, dropped messages, risk-path timing, and whether the real production system still matches the architecture everyone believes they built.
Debugging is not the same as observability
A lot of engineers still conflate observability with debugging output. They add logs, maybe a few counters, and assume they now have visibility. But visibility that only becomes useful after the incident has fully formed is not enough for systems that trade, route orders, evaluate risk, or process fast market events.
Real observability is about making system behavior legible while the system is alive and under load. It should help answer not just what failed, but what was happening before failure, how timing shifted across components, where contention accumulated, which path became noisy, and whether the system degraded gradually or collapsed suddenly. That kind of insight is especially important in Rust-based infrastructure because the language often enables highly concurrent, highly efficient systems whose failure modes are subtle rather than loud.
Low-latency systems cannot afford noisy instrumentation
One reason some teams underinvest in observability is that they fear the cost of measuring the system will distort the system. In low-latency environments, that concern is not irrational. Bad instrumentation can absolutely create overhead, contention, allocation churn, or noise on the wrong path.
But the answer is not to ignore visibility. The answer is to design observability with the same seriousness as execution. If a market data loop, matching path, or risk engine is sensitive to tail latency, then logging and tracing must be engineered to respect that reality. Structured events, deferred formatting, isolated sinks, careful queue design, and narrow hot-path instrumentation all matter. The point is not to log everything everywhere. The point is to preserve enough truth about system behavior without contaminating the path you are trying to understand.
That is one reason Rust fits observability-heavy systems well. The language gives teams more control over allocation, concurrency, backpressure, and data movement, which makes it easier to build instrumentation that remains disciplined instead of casually expensive.
Tracing matters because distributed timing lies easily
A modern financial system is rarely one process doing one job. It is usually a graph of services, workers, event streams, risk checks, execution paths, storage layers, and edge interfaces. Once behavior crosses process boundaries, simple logs start to lose coherence very quickly.
This is where tracing becomes important. Not because it is fashionable, but because distributed systems lie easily when timing is reconstructed from isolated messages. A request that looked slow in one service may actually have spent most of its time blocked upstream. A risk path that appears healthy in aggregate may contain rare but dangerous latency spikes. A strategy engine may blame the execution layer when the real issue was scheduling drift in a feeder component.
Good tracing makes causality easier to recover. It helps teams follow one path across asynchronous boundaries, thread handoffs, queue transitions, and service calls. In trading and financial systems, that is often the difference between vague suspicion and usable diagnosis.
Metrics without architecture context become noise
Metrics are essential, but they are often collected without enough thought about what system behavior they are supposed to explain. Teams gather CPU graphs, memory graphs, request counts, and generic success rates, then discover during an incident that none of those numbers explain the actual failure.
Useful metrics have to be tied to architecture. In a trading platform, that means measuring the things the architecture claims to care about: queue depth, publish-to-consume delay, market data freshness, risk check latency, order dispatch timing, error class distribution, retry behavior, dropped event counts, and divergence between expected and realized execution flow. If those numbers are not visible, then the dashboard is describing the machine from the outside while the real failure happens inside.
This is where observability becomes a design discipline rather than an afterthought. The metrics should reflect the invariants and assumptions the architecture depends on. If a system says the hot path must stay isolated, there should be signals proving whether it actually does. If a system says risk checks stay within a strict latency budget, there should be direct evidence when that stops being true.
Rust encourages better telemetry boundaries when teams use it well
Rust does not automatically create good observability, but it does encourage stronger boundaries when teams are disciplined. Ownership, types, and explicit control flow can make it easier to define where telemetry should be emitted, what events are meaningful, and which components actually own which pieces of state.
That matters because observability quality is often a boundary problem. If no one owns the lifecycle of an order after a certain point, the telemetry becomes fragmented. If event meaning changes as data crosses modules, the logs become harder to trust. If one subsystem emits rich structured spans while another emits unstructured strings, diagnosis becomes slower exactly when the team needs coherence.
In Rust, those seams are often more visible, which can be an advantage. A well-designed system can make spans, counters, and structured events align with the same domain boundaries that organize the code. When that happens, observability starts reflecting the real shape of the system rather than an accidental collection of print statements.
The worst time to discover blind spots is during market stress
Observability gaps often stay invisible when the system is calm. Under light load, almost any architecture looks healthy enough. Problems reveal themselves when throughput climbs, markets move violently, services retry together, queues fill, and all the hidden assumptions about timing begin to matter.
That is exactly why observability should be designed for stressful conditions rather than ideal ones. Teams need to know what they will still be able to see when log volume surges, when traces become expensive, when buffers fill, and when one failure begins to cascade into secondary ones. If the visibility model collapses at the same moment the production system does, it was never a real visibility model at all.
In trading infrastructure, this is not theoretical. The conditions that create the most risk are often the same conditions that make diagnosis hardest. Fast markets, bursty events, exchange instability, and overloaded internal paths all compress decision time. Observability that only works when nothing interesting is happening is operational theater.
Post-trade monitoring is part of the execution story
Many teams think of observability as something that belongs to platform or SRE concerns, while execution quality belongs to trading logic. That separation is too clean to be useful. In reality, post-trade monitoring, auditability, event integrity, and timing analysis are part of the execution story itself.
A system cannot claim to execute well if it cannot explain how it executed. It cannot claim to manage risk well if it cannot reconstruct what happened across a critical path. It cannot claim to be production-ready if a suspicious fill, missed event, or delayed hedge turns into a forensic mystery. Observability is not external to correctness. In systems where timing and ordering matter, it is one of the ways correctness is defended after deployment.
That is also why logs, traces, and metrics should not only serve engineers. They should support operators, risk teams, and anyone responsible for understanding whether the platform behaved acceptably under real conditions. A mature system makes operational truth easier to access, not harder.
Good observability respects the hot path and tells the truth anyway
There is always a tension in low-latency infrastructure between visibility and disturbance. Too much instrumentation can interfere with the system. Too little leaves the team blind. The answer is not maximalism or minimalism. It is precision.
Good observability in Rust-based financial systems means knowing which events deserve hot-path treatment, which data can be sampled, which formatting should be deferred, which sinks should be isolated, and which questions the system must always be able to answer during stress. It means treating telemetry as part of system design, not as developer decoration.
That is why the most serious teams build observability early. Not because dashboards are impressive, but because production truth becomes harder to recover once a fast system is already live. When the market is moving, the queues are deep, and something feels wrong, the system has to be able to explain itself. If it cannot, the problem is not only missing telemetry. The problem is that the architecture was never fully honest about how it would be operated.
If you need help designing or hardening observability for Rust-based financial infrastructure (low-latency services, trading systems, risk paths, structured telemetry, or production diagnostics), you can request a high-performance infrastructure engagement through the Services page or reach out directly via the Contact terminal.