Observability in Go: seeing what your crypto platform is really doing
Why observability is a first-class concern for Go-based crypto platforms, and how to treat logs, metrics, and traces as part of the architecture.
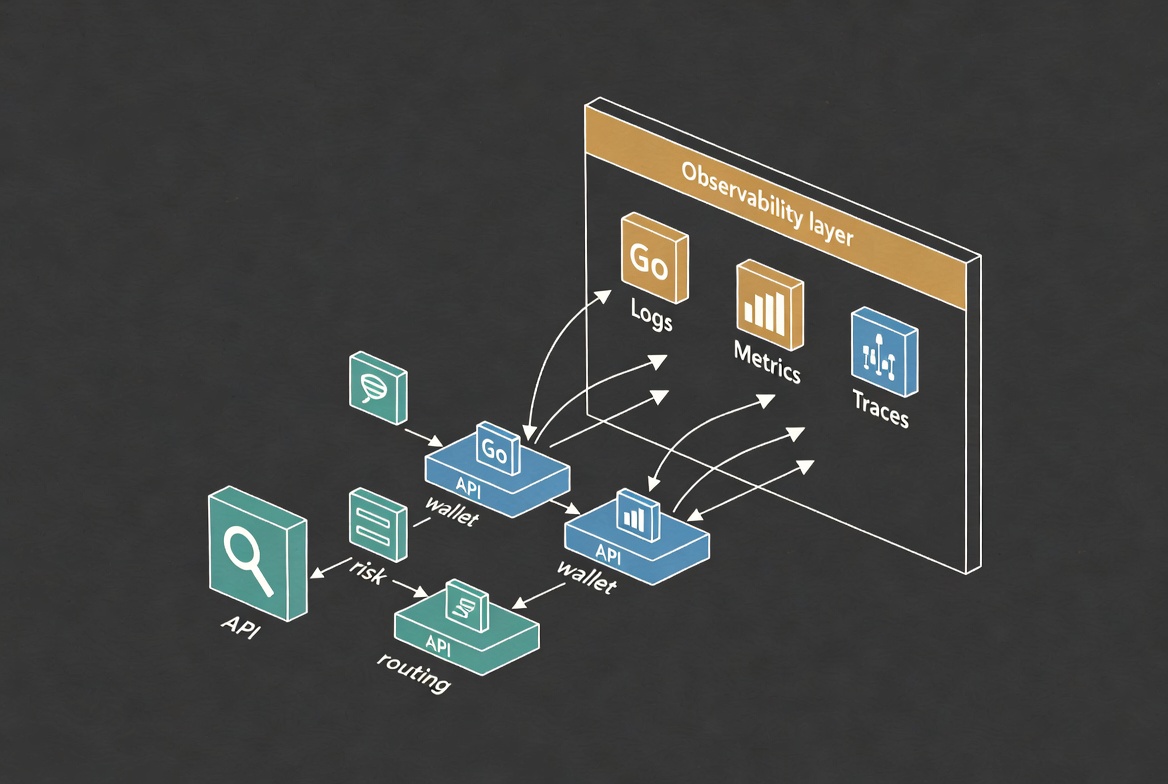
Most discussions about Go in crypto focus on performance, concurrency, or microservices. Those all matter, but they are not what keeps a platform alive during real incidents. When withdrawals stall, orders misbehave, or risk checks fire unexpectedly, the difference between a contained event and a prolonged outage is usually not a clever goroutine. It is observability.
For a Go-based crypto or financial platform, observability is not optional decoration. It is the part of the system that tells you what your services are actually doing: which requests they see, which decisions they make, how long they take, and where they are failing. Without that, even well-written code becomes a black box as soon as it hits production.
Observability is about questions, not tools
Tools and libraries matter, but observability starts with questions: What happened? Why did it happen? Where did it happen? How often does it happen? Who is affected? In a crypto stack, those questions apply to deposits, withdrawals, order routing, wallet events, risk decisions, and integration with external venues and chains.
Go’s ecosystem makes it reasonably straightforward to emit logs, metrics, and traces from microservices. According to the OpenTelemetry Go documentation, collecting standardized telemetry data across distributed applications is essential for vendor-agnostic systems analysis. The key is deciding what should be measured and how those signals map to the domain of the platform. That means designing telemetry around business events — “withdrawal request created,” “order rejected by limit,” “wallet broadcast failed,” “reconciliation mismatch” — not just around technical ones.
Logs are narratives, not just strings
In many systems, logs are treated as append-only strings of convenience — printouts that developers scatter around code to help during debugging. For a serious crypto platform, that is not enough. Logs are narratives: they describe the story of a request or event as it moves through services and decisions.
A Go service that handles something important — say, a withdrawal path or an order routing step — should log structured events that include identifiers, key fields, outcomes, and context, not just free-form messages. When those logs are consistent across services, it becomes possible to reconstruct the path of a problematic transaction without guessing. That is critical both for incident response and for post-incident analysis in financial environments.
Metrics tell you about health before users do
Metrics are how a platform notices that something is off before users start opening tickets. Frameworks like Prometheus allow Go-based services to expose time-series counters, gauges, and histograms for key behaviors: throughput per endpoint, error rates, latency distributions, queue depths, wallet broadcast failures, reconciliation lag, and so on.
In crypto, some of these metrics should be explicitly tied to product concepts: deposits stuck beyond expected confirmation windows, withdrawals waiting on approvals, orders failing venue-side, or unusually high risk rule triggers. When Go services export these metrics consistently, an observability stack can alert on patterns that indicate emerging issues instead of waiting for a full outage.
Traces show where reality diverges from diagrams
Architectural diagrams show boxes and arrows. Traces show what actually happens. A distributed trace across Go services can reveal slow hops, retries, unexpected fan-out, or loops that never made it into design documents. For a crypto platform, that level of visibility becomes crucial when an issue spans multiple domains: user API, risk, routing, wallet services, and external providers.
By instrumenting Go services with trace spans that align with domain boundaries — “risk evaluation,” “wallet broadcast,” “venue submit,” “reconciliation query” — teams can see not only where time is spent but also where the flow diverges from expectation. That is often the shortest path to root cause when behavior is correct “in theory” but broken in production.
Observability should be part of the Go service contract
If observability is bolted on at the end, it will always feel like extra work. A healthier approach is to treat telemetry as part of the service contract: when a Go service is created, it is expected to expose logs, metrics, and traces in a consistent way from the start.
That means adopting clear conventions around structured logging, metric naming and cardinality, and trace boundaries across services, then baking those into internal libraries or templates. The goal is not to reinvent observability in every project, but to give teams a baseline that makes good telemetry the default instead of an exception.
Crypto platforms have special observability needs
Crypto adds several observability challenges on top of normal backend work. On-chain events interact with off-chain services. External venues and providers change behavior. Latency and reliability vary across chains, networks, and partners. Regulatory expectations increase the need for audit trails and post-hoc analysis.
Go-based services that sit at these boundaries — especially wallet, routing, and risk services — should emit signals that reflect those realities: chain-specific statuses, venue-level health, transaction identifiers that are traceable across systems, and clear markers for user-visible events and failures. When those signals are present, the platform stops feeling like a black box and starts behaving like an instrumented machine.
Why this matters more than another optimization
It is tempting, especially with a language like Go, to focus on micro-benchmarks, fine-tuned goroutine usage, or optimizations in individual handlers. Those can be valuable, but they are not what will decide whether a platform survives its worst day.
On the worst day, what matters is whether the team can answer questions quickly and confidently: what broke, where it broke, who is affected, and how to roll back or move forward. That is an observability problem. For a crypto platform built in Go, investing in logs, metrics, and traces is not a luxury. It is part of building a system that can be trusted when it is under stress.
Knowledge Base / FAQ
Frequently Asked Questions
Why is observability more critical than micro-optimizations in Go crypto platforms?
During live operational incidents or market volatility, speed of diagnosis determines recovery time. Observability provides structured visibility into system bottlenecks, failed wallet broadcasts, and API stalls, whereas micro-optimizations offer marginal gains during normal execution.
How do structured logs differ from unstructured logging in Go microservices?
Structured logs emit key-value pairs (e.g., JSON) with consistent contextual identifiers like transaction IDs, wallet addresses, and execution statuses. This allows log aggregators to query, correlate, and reconstruct complex transaction flows across distributed services.
What product-level metrics should a Web3 backend export?
In addition to standard system metrics, Web3 backends should track domain-specific time-series data, such as unconfirmed deposit counts, withdrawal approval queue depths, venue execution rejection rates, and chain reconciliation lag.
How does distributed tracing accelerate root-cause analysis across venues and chains?
Distributed tracing propagates context headers across service boundaries, mapping a request's journey from the edge API through risk engines, wallet managers, and external venue APIs to pinpoint precise latency bottlenecks or drop-offs.
Can Zanvexis help instrument and optimize observability for Go platforms?
Yes. Zanvexis specializes in engineering observability pipelines for Go systems, integrating OpenTelemetry tracing, Prometheus time-series metrics, structured logging standards, and incident-ready diagnostic dashboards.
If you need help turning your Go-based crypto platform into something you can actually see and reason about — from structured logging and metrics to traces and incident-ready dashboards — you can request a security-focused engagement through the Services page or reach out directly via the Contact terminal.
Need help building secure technology?
Explore how Zanvexis helps teams build secure software, blockchain systems, intelligent platforms, and high-performance infrastructure.
Explore all services →Continue reading
Related articles
Trading infrastructure stops being resilient the moment incident response depends on heroics instead of architecture
Why serious trading platforms need incident response and operational resilience designed into architecture, tooling, and governance instead of relying on ad hoc fixes and individual effort during outages.
Crypto custody stops being security and becomes counterparty exposure when architecture depends on people behaving well
Why institutional-grade crypto custody has to enforce separation of duties, destination controls, cryptographic dual control, and operating model discipline in architecture instead of trusting operator conduct.
Trading bots become brittle when architecture pretends every market is the same
Why serious trading bot infrastructure needs clear separation between exchange adapters, strategy logic, execution paths, risk controls, and observability instead of one-size-fits-all bots.